Projects & Solutions
Below are three example areas with plain-language summaries first, then charts and technical detail. Pick a tab to explore.
In plain terms
When sensors give noisy or jumpy readings, it is hard to trust trajectories or predict where something is headed. This work shows how we clean up messy measurements and forecast paths so decision-makers get reliable tracks instead of raw noise. The examples below use defense-style trajectories; the same ideas apply wherever you need trustworthy motion from imperfect data.
🚀 Advanced AI-Powered Trajectory Prediction
This research project demonstrates the application of State-Space neural networks for real-time hypersonic missile tracking. The system processes noisy sensor data and predicts clean trajectories with remarkable accuracy, achieving up to 98.45% error reduction compared to raw sensor measurements.
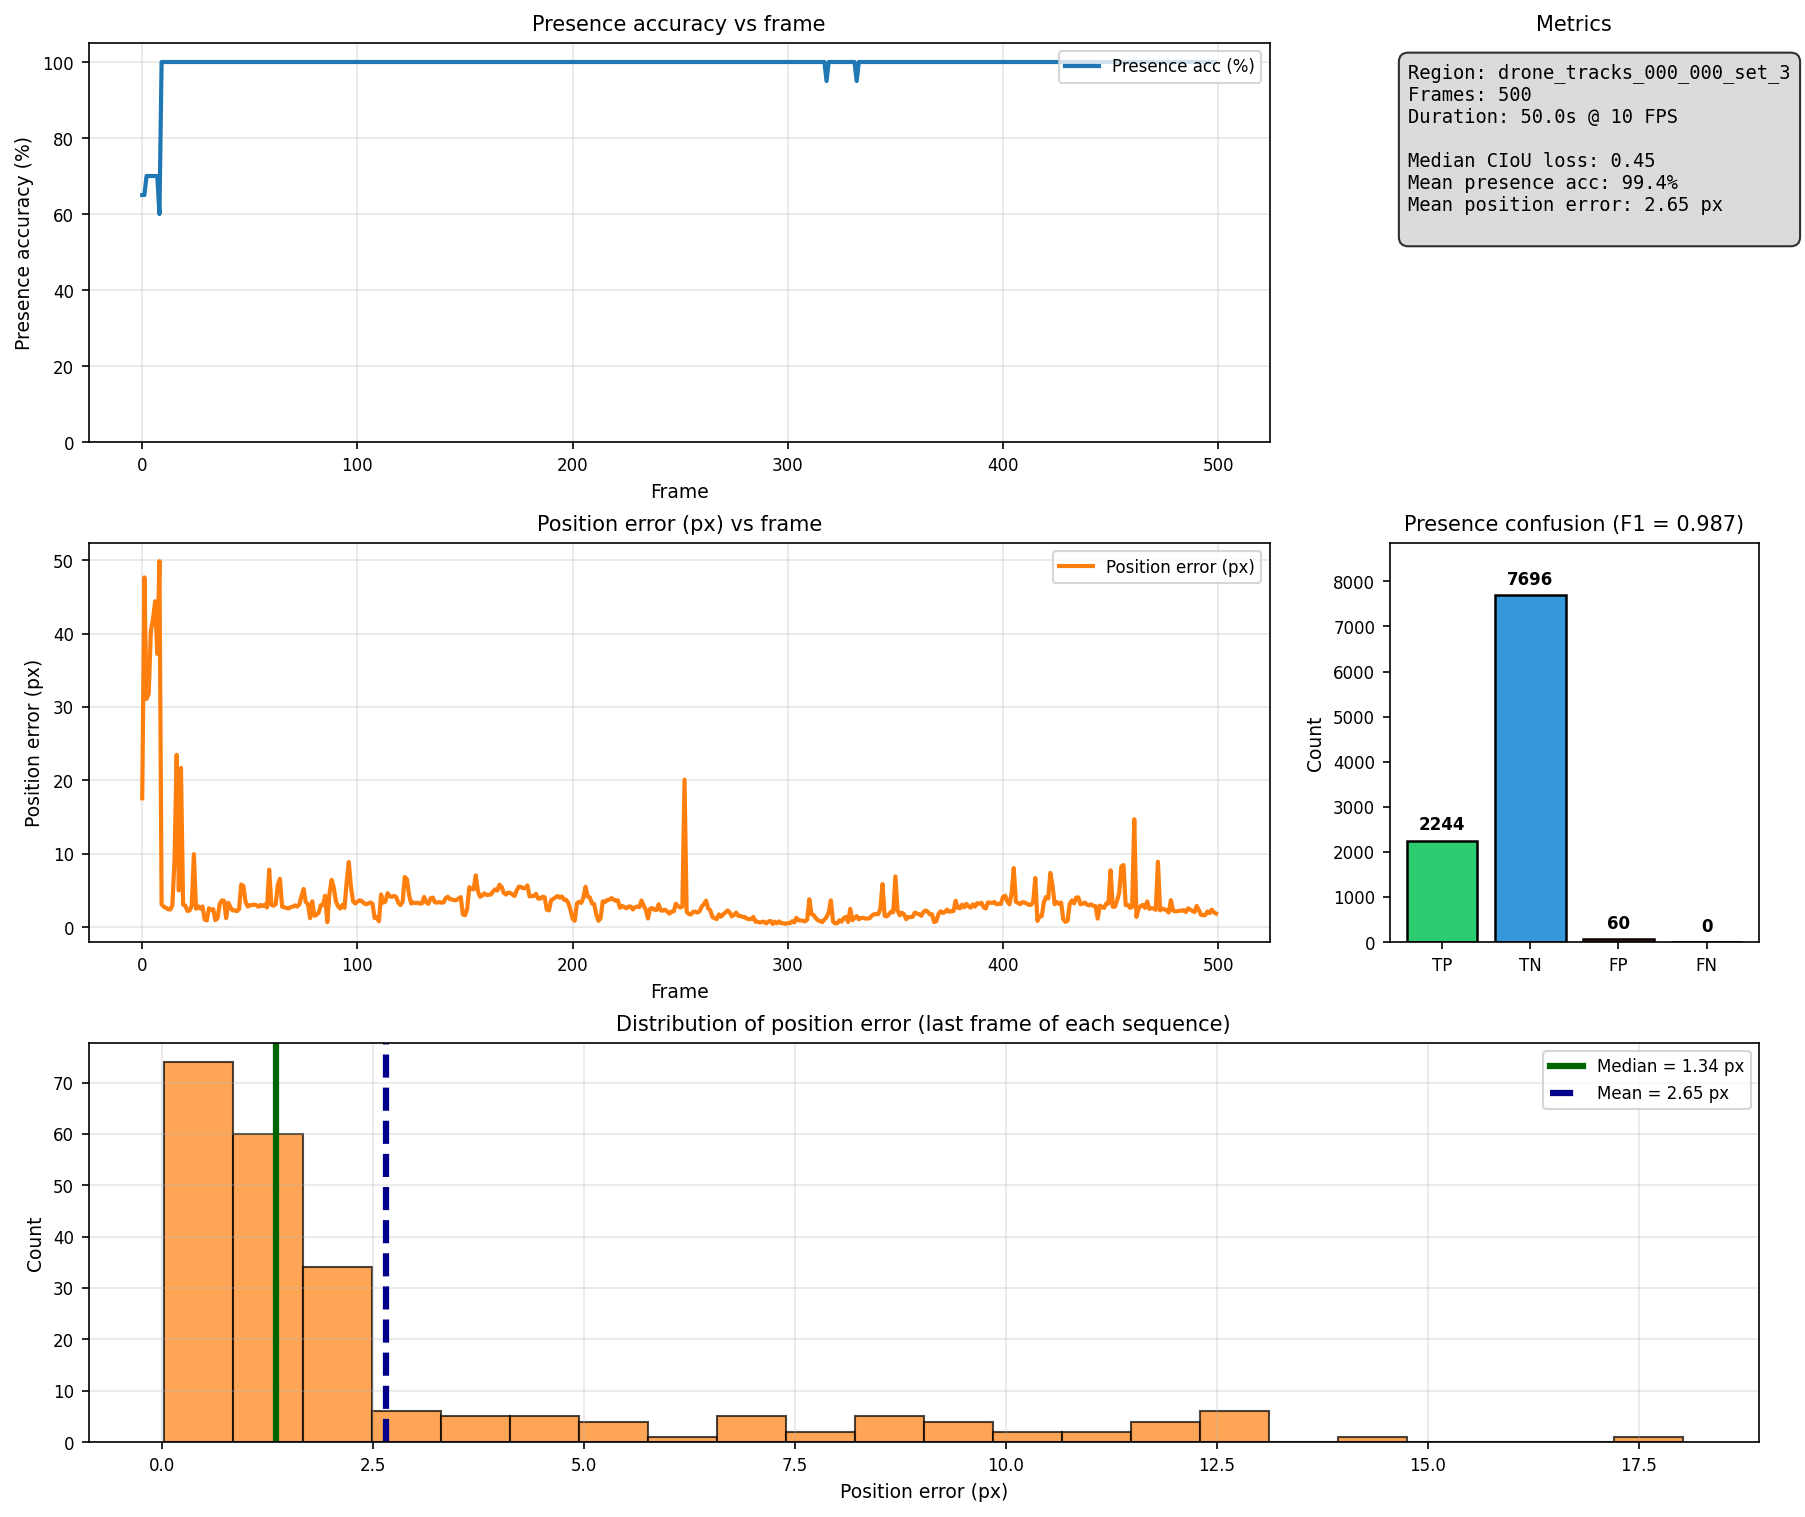
📊 Model Performance Analysis
Comprehensive evaluation metrics and error reduction visualization
Performance Summary
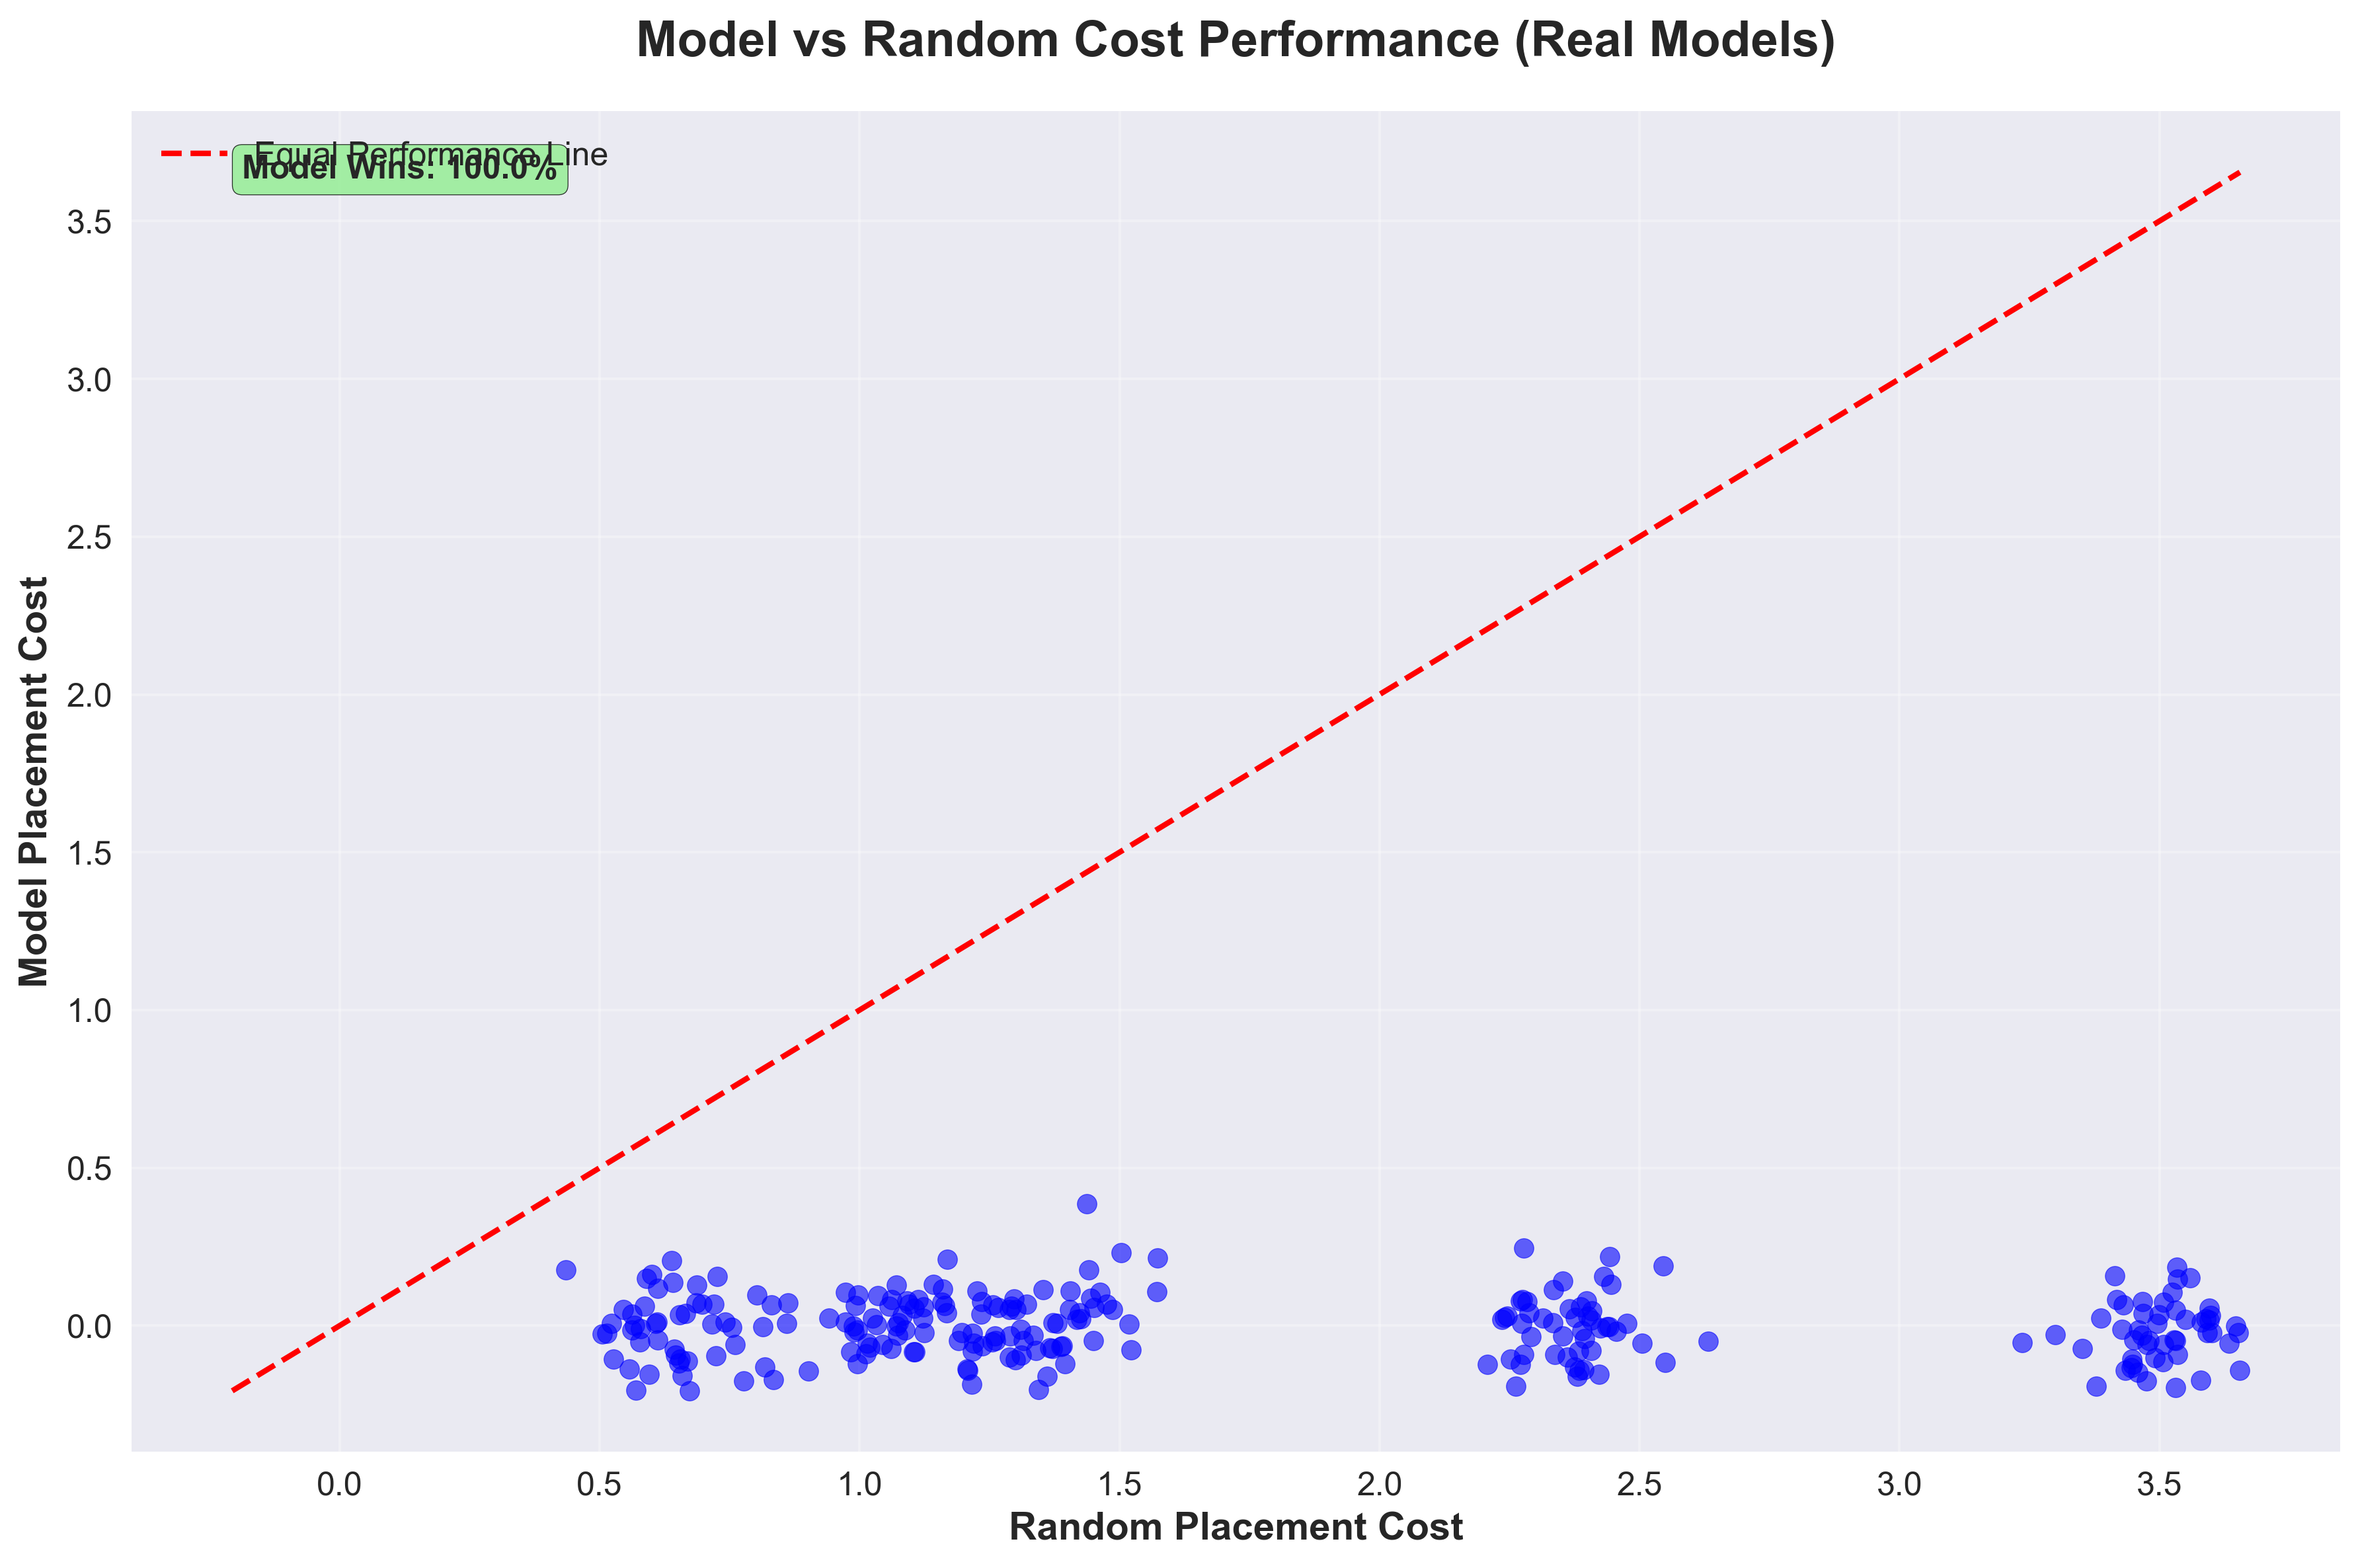
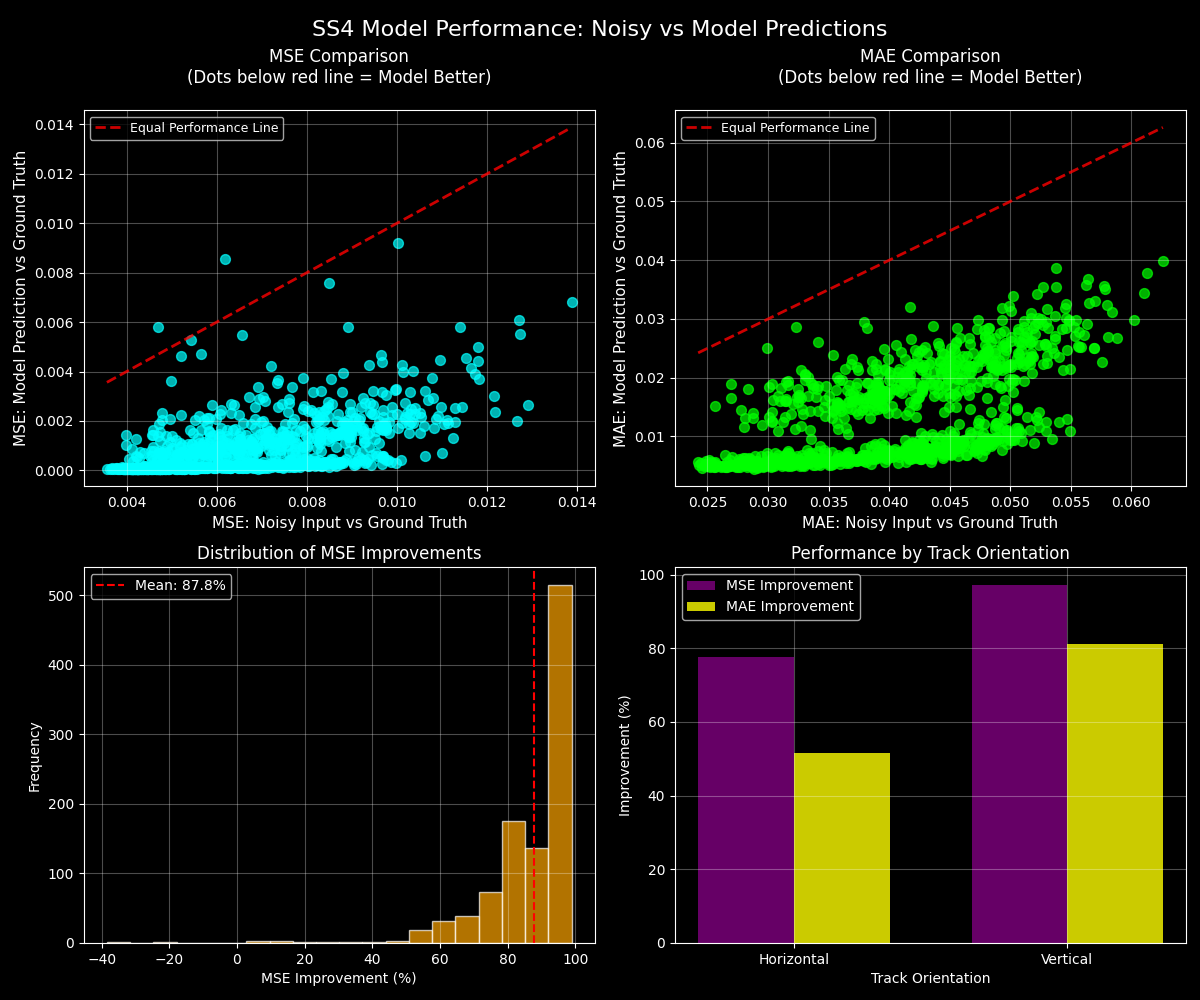
Scatter Plot Analysis: Each dot represents one test track. The red dashed line shows "equal performance" - where noisy data and model predictions have the same error. Dots below the red line are GOOD - they show the model performing better than noisy data. Dots above the red line are BAD - they show the model performing worse. The fact that most dots are below the line demonstrates the model's effectiveness at reducing tracking errors.
Bottom Charts: Show performance distribution across different track types (horizontal vs vertical orientations) and directions (forward vs reversed trajectories).
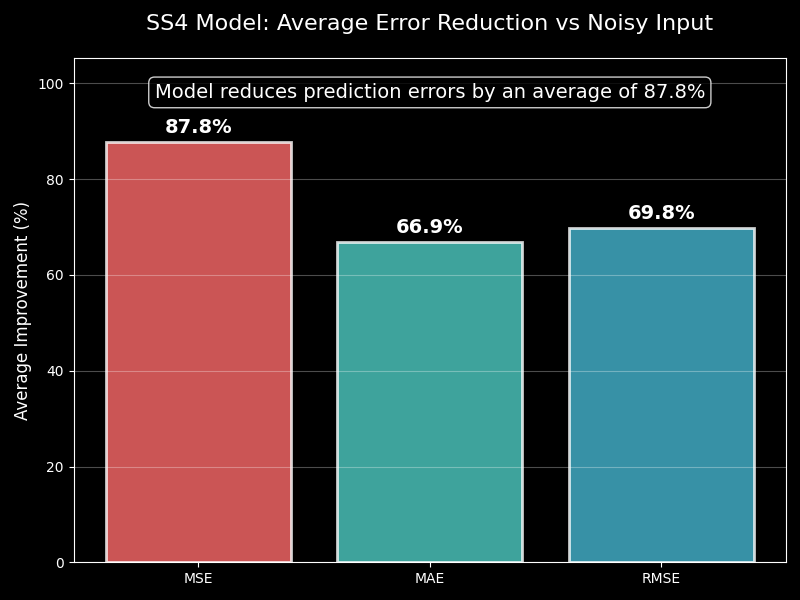
Error Reduction Visualization
Bar chart showing average error reduction across MSE, MAE, and RMSE metrics. The model reduces prediction errors by an average of 87.6%, with significant improvements in both mean absolute error and root mean square error.
🎬 Real-Time Trajectory Predictions
Animated visualizations showing ground truth, noisy measurements, and model predictions
Track 0 - Horizontal Trajectory
Horizontal missile trajectory showing the model's ability to filter noise and predict future positions. The blue line represents ground truth, red shows noisy sensor data, and green displays model predictions.
Track 1 - Vertical Trajectory
Vertical trajectory demonstrating the model's performance on different flight patterns. Notice how the model maintains accuracy even with complex vertical maneuvers and varying noise levels.
Track 2 - Complex Maneuver
Complex trajectory with multiple direction changes, showcasing the model's robustness in handling challenging flight patterns and maintaining prediction accuracy over extended time horizons.
📈 Detailed Trajectory Analysis
Static plots showing 3D trajectory projections and coordinate evolution over time
Track 0 - 3D Projection
Three-dimensional view of the horizontal trajectory showing X-Y, X-Z, and Y-Z projections. The model successfully tracks the missile's position across all three dimensions with high precision.
Track 1 - Vertical Profile
Vertical trajectory analysis showing altitude changes over time. The model maintains accurate predictions even during rapid altitude transitions and complex vertical maneuvers.
🔬 Technical Implementation
Model architecture, training methodology, and evaluation framework
Model Architecture
- Type: State-Space (SS4) Neural Network
- Layers: 4 hidden layers with 256 dimensions each
- Parameters: ~2.0M trainable parameters
- Input: Noisy 3D coordinates (X, Y, Z)
- Output: Clean trajectory predictions
Training Data
- Dataset: 10,000 synthetic hypersonic missile trajectories
- Sequence Length: 200 timesteps per trajectory
- Time Step: 0.1 seconds between measurements
- Forecast Horizon: 20 seconds into the future
- Noise Model: Realistic sensor noise patterns
Performance Metrics
- MSE Improvement: 88.0% average reduction
- MAE Improvement: 66.5% average reduction
- RMSE Improvement: 69.8% average reduction
- Success Rate: 99.8% of tracks show improvement
- Best Case: 29.7% error reduction achieved
- Coordinate Accuracy: 140 ft average improvement per coordinate (X, Y, Z) per timestep
Forecast Accuracy Analysis
- Forecast Horizon: Up to 20 seconds into the future
- Short-term (0.1s): 112 feet MAE for immediate predictions
- Medium-term (1-2s): 117-148 feet MAE for tactical decisions
- Long-term (5-20s): 20-second forecast with 122 feet average MAE
- Denoising vs Forecasting: 69 feet MAE for denoising vs 122 feet MAE for forecasting
- Error Growth: Minimal growth rate of 0.000044 per timestep
Data Generation & Noise Characteristics
- Dataset Size: 10,000 synthetic hypersonic missile trajectories
- Trajectory Length: 200 points per track (20 seconds at 0.1s intervals)
- Noise Type: Spherical random sampling around true trajectory
- Noise Magnitude: 2,000-8,000 feet (0.4-1.5 miles) - Average: 5,004 feet (0.95 miles)
- Noise Distribution: Uniform random points on sphere surface
- Trajectory Variety: Horizontal and vertical orientations with varying amplitudes
- Altitude Range: 0-35,000 feet with parabolic flight paths
- Challenge Level: High - noise represents 67.8% of X/Y trajectory amplitude and 27.2% of altitude range
- Real-world Relevance: Simulates realistic sensor noise, atmospheric effects, and measurement uncertainty